Respect-SaaS
end to end, from discovery to polished MVP and next steps
40% reduction in time to publish
30% fewer data errors
High confidence score
The Product
traceability tool to collect, organize, and manage verified data across suppliers, which at the end can be published to the public transparency platform Respect-Code.
The Challenge
Companies are under increasing pressure to prove where their products come from — from regulators, consumers, and partners. Most supply chain data already exists, but it’s fragmented across spreadsheets, PDFs, emails, and ERP systems. Publishing that data in a transparent, credible way is slow, error-prone, and expensive.
The goal was to design a SaaS tool that allows companies to trace supply chains end-to-end and publish them on a public-facing website in a way that is structured, trustworthy, and easy to maintain.
My Role
End-to-End
Research
IA
Flows
Wireframing
Usability Testing
Team
PO
BA
2 frontend engineers
2 backend engineers
UX/UI Designer
Usability Testing
What I Accomplished
- 40% reduction in time to publish supply chains.
- 30% fewer data errors after visualization launch.
- high confidence scores reported by beta users.
Problem Statement
How might we help organizations create, manage, and publicly share complex supply chains — including suppliers and certificates — without requiring deep technical knowledge or weeks of setup?
Until that point, the company's internal tool depended on skilled transparency experts (customer success managers) taking months to collect organize and publish the supply chains.
Interview goal 1
What motivates the clients to continue with the transparent communication of their products?
Interview goal 2
What makes them request separate custom platforms for their brand?
Interview goal 3
What are the challenges that the business and development is facing because of the custom platforms?
Users & Needs
building the sections: from wireframes to polished UI
Primary Users
Sustainability & Compliance Managers
- Need accurate, auditable supply chain data
- Must demonstrate compliance with regulations
- Care about traceability and certificates
Product & Operations Managers
- Manage product catalogs and suppliers
- Need efficient import and editing tools
- Want to minimize manual work
Secondary Users
Sustainability & Compliance Managers
- Can view or manage only specific data based on the role
- Can view, manage and verify specific related documents or certificates
- Can verify or invite their direct suppliers
I structured the Tool around 4 core modules:
1. Products
- Create products manually
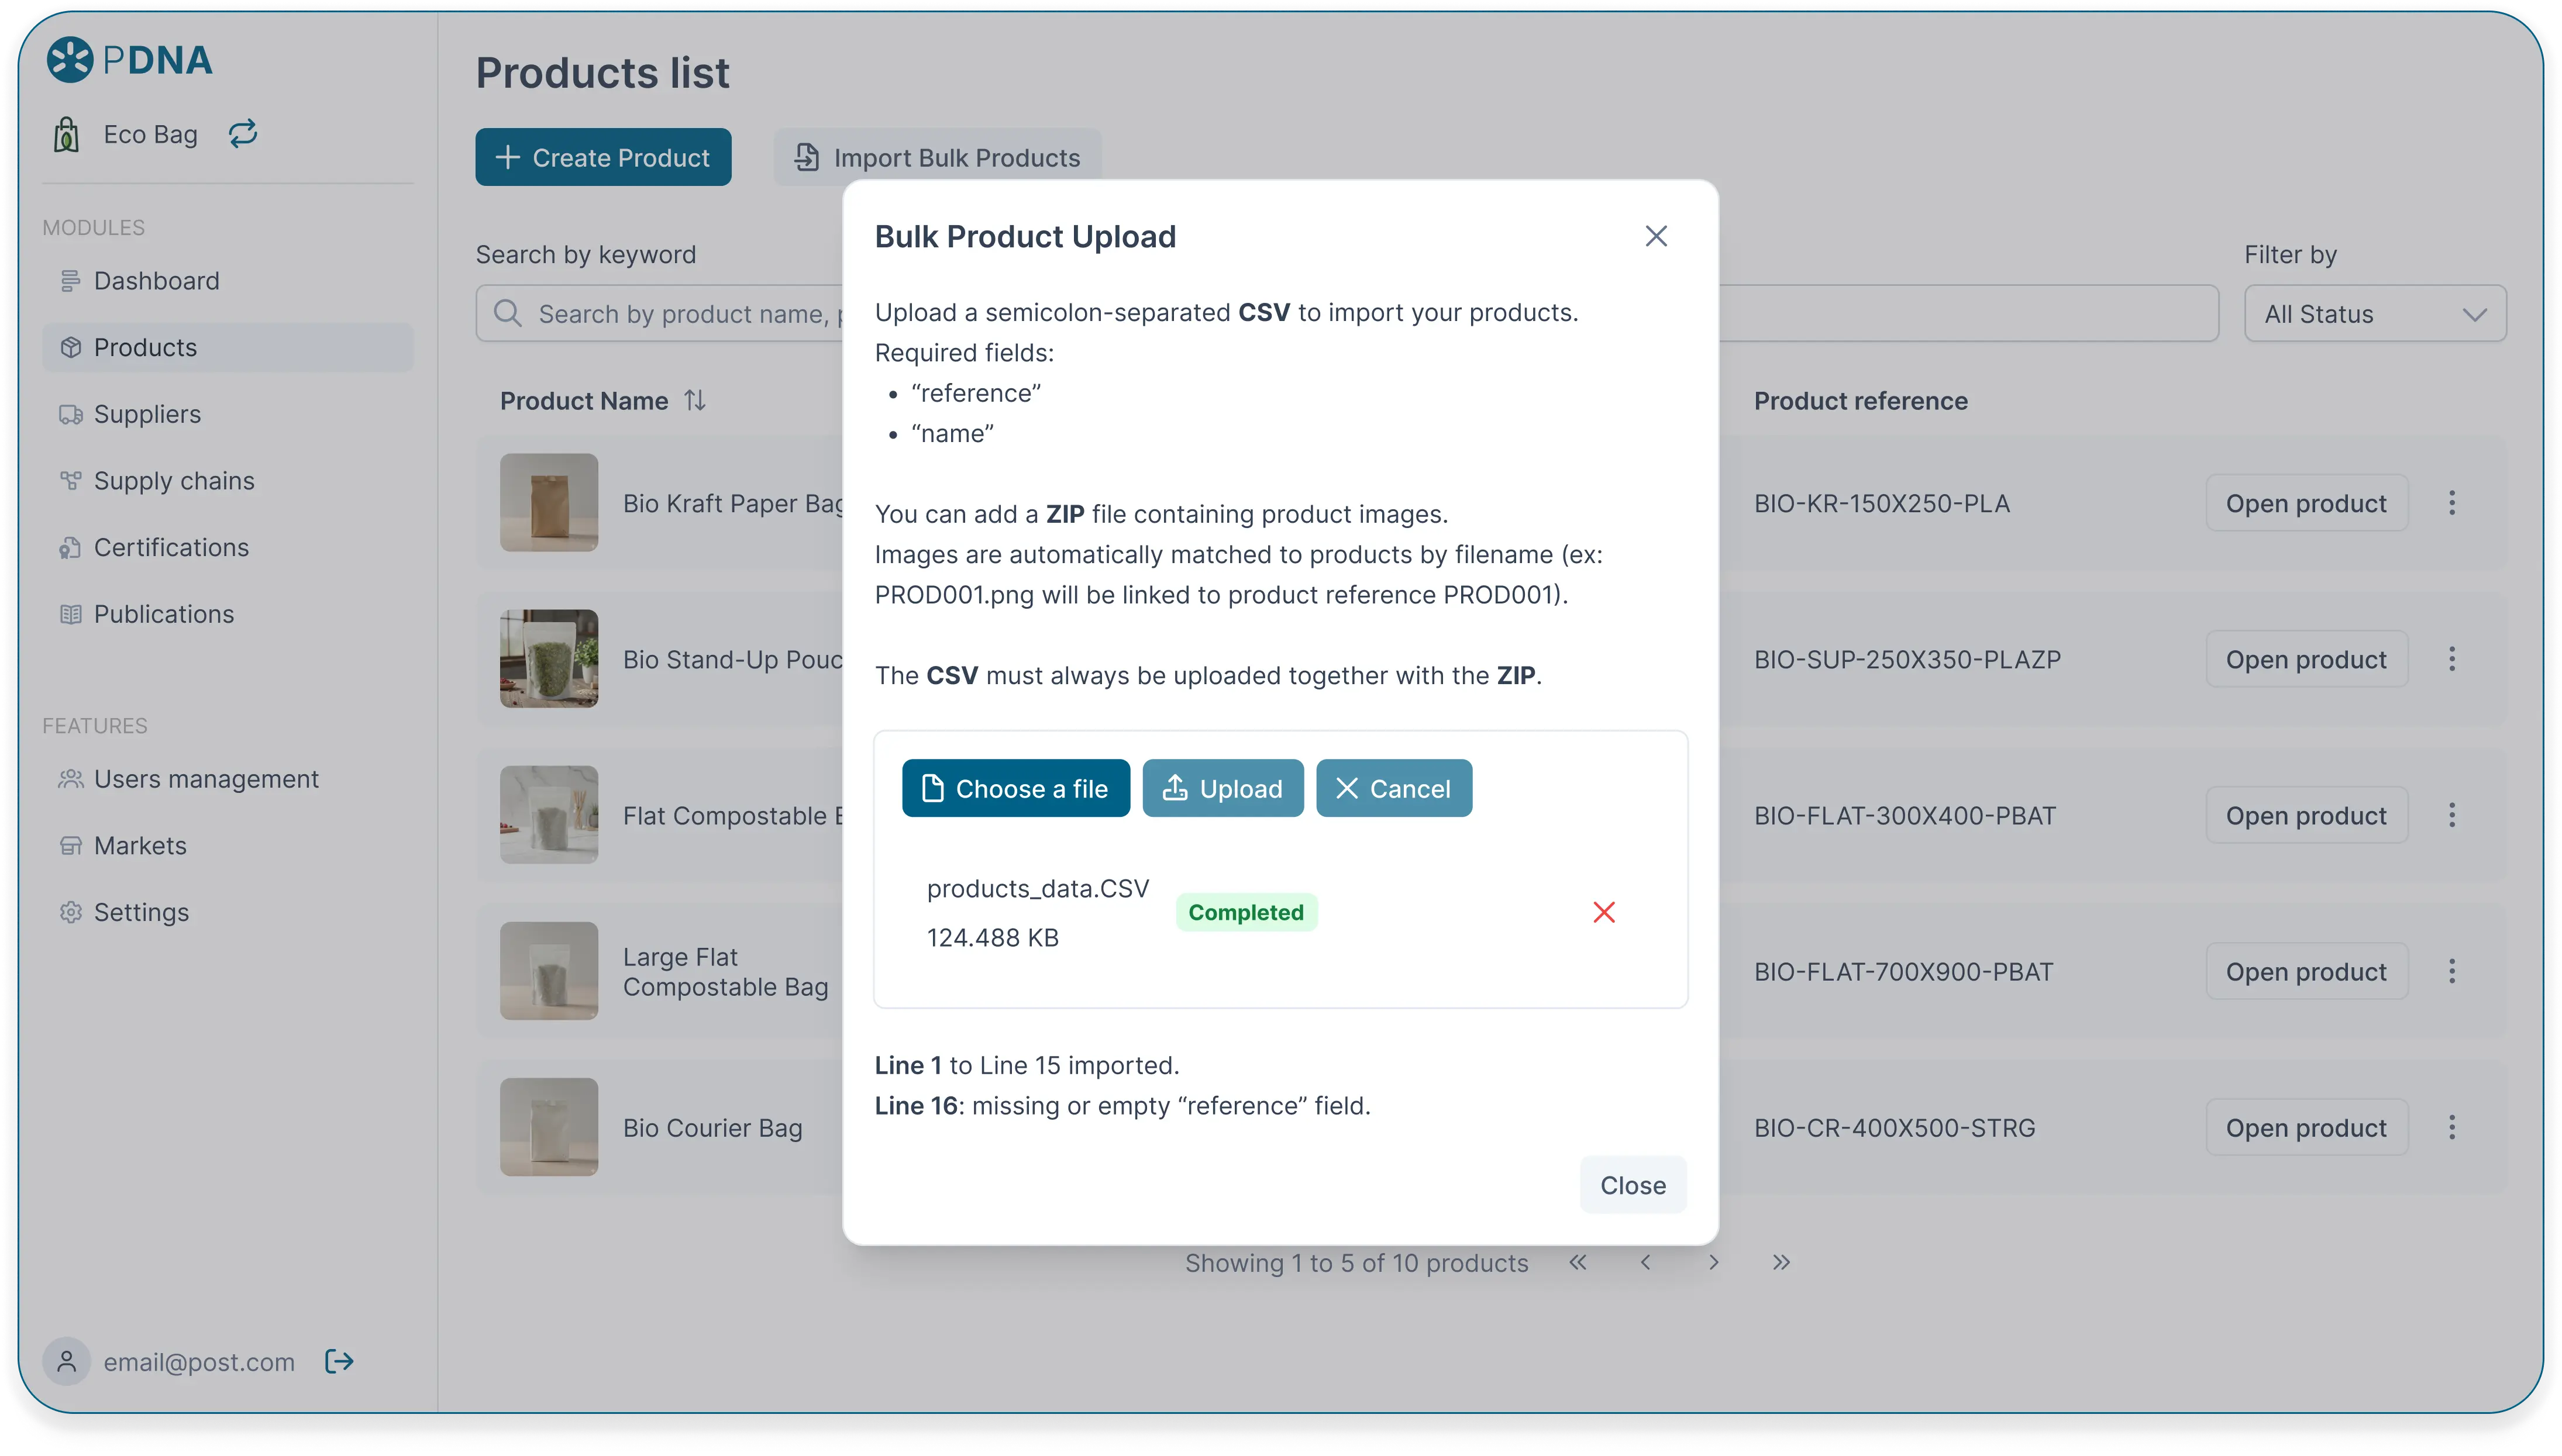
- Import products via CSV
- Manage product metadata
2. Suppliers
- Create or import suppliers
- Define supplier type, location, and role
- Reuse suppliers across multiple products
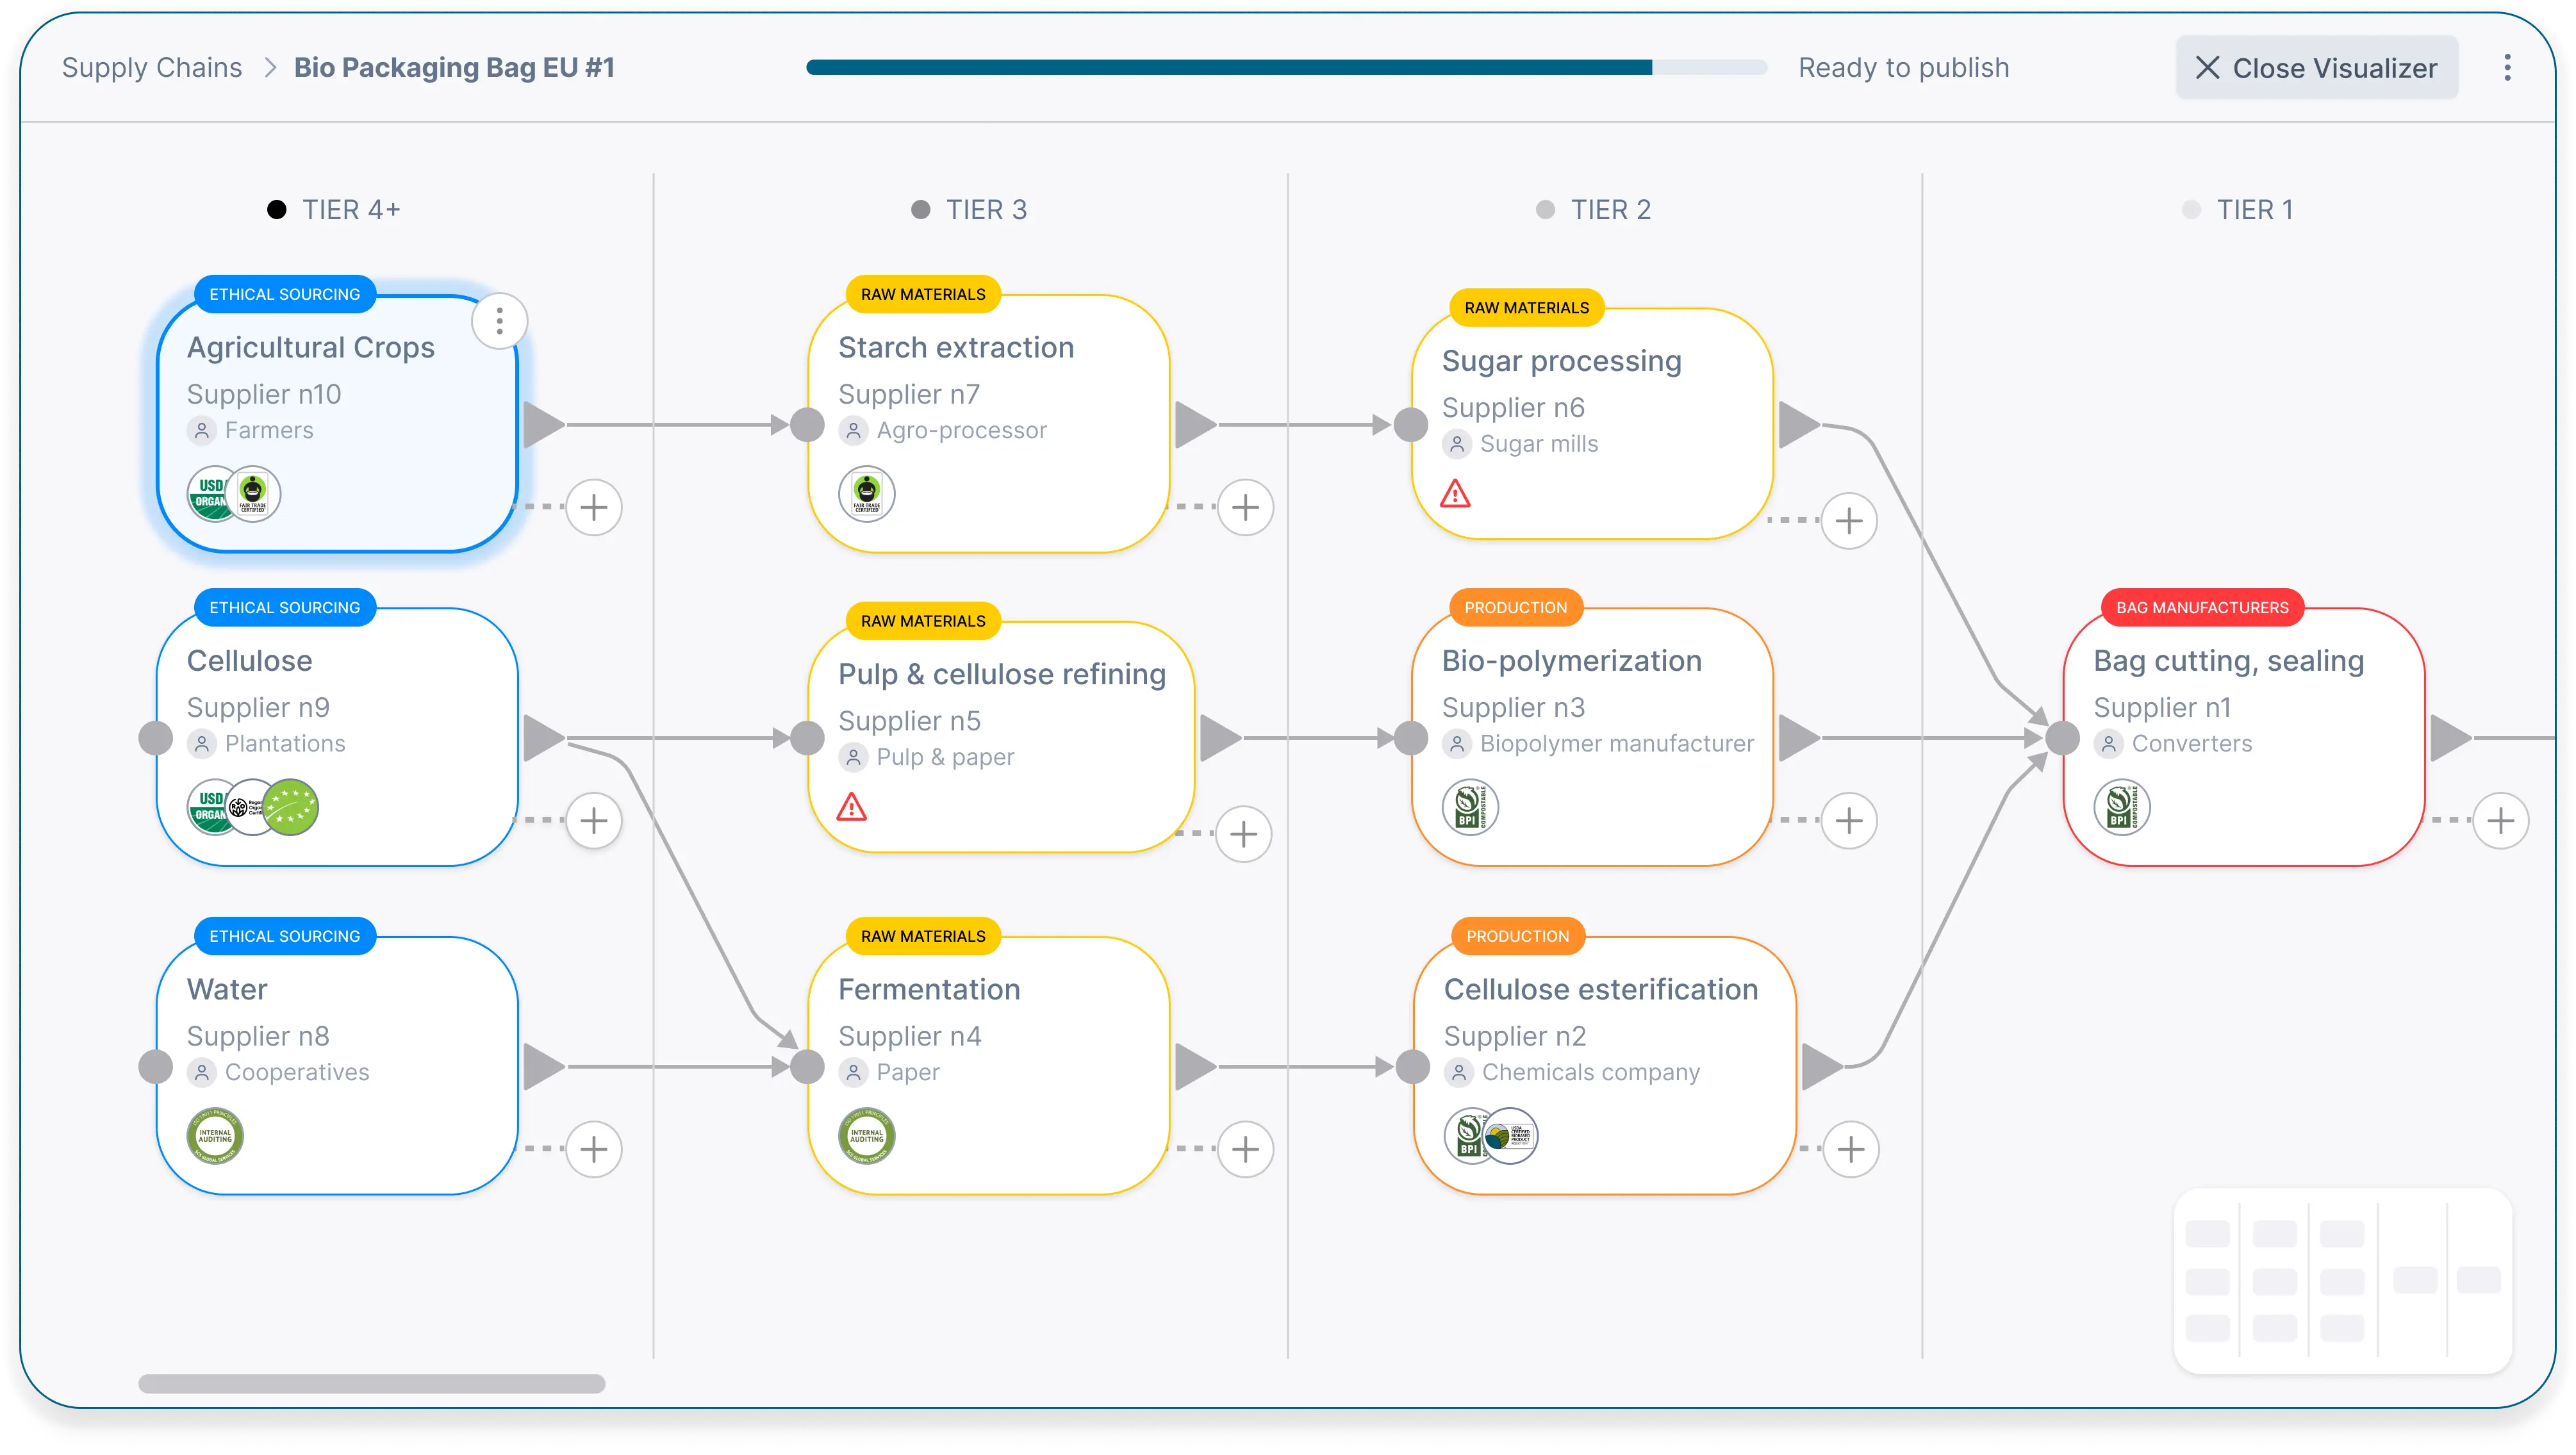
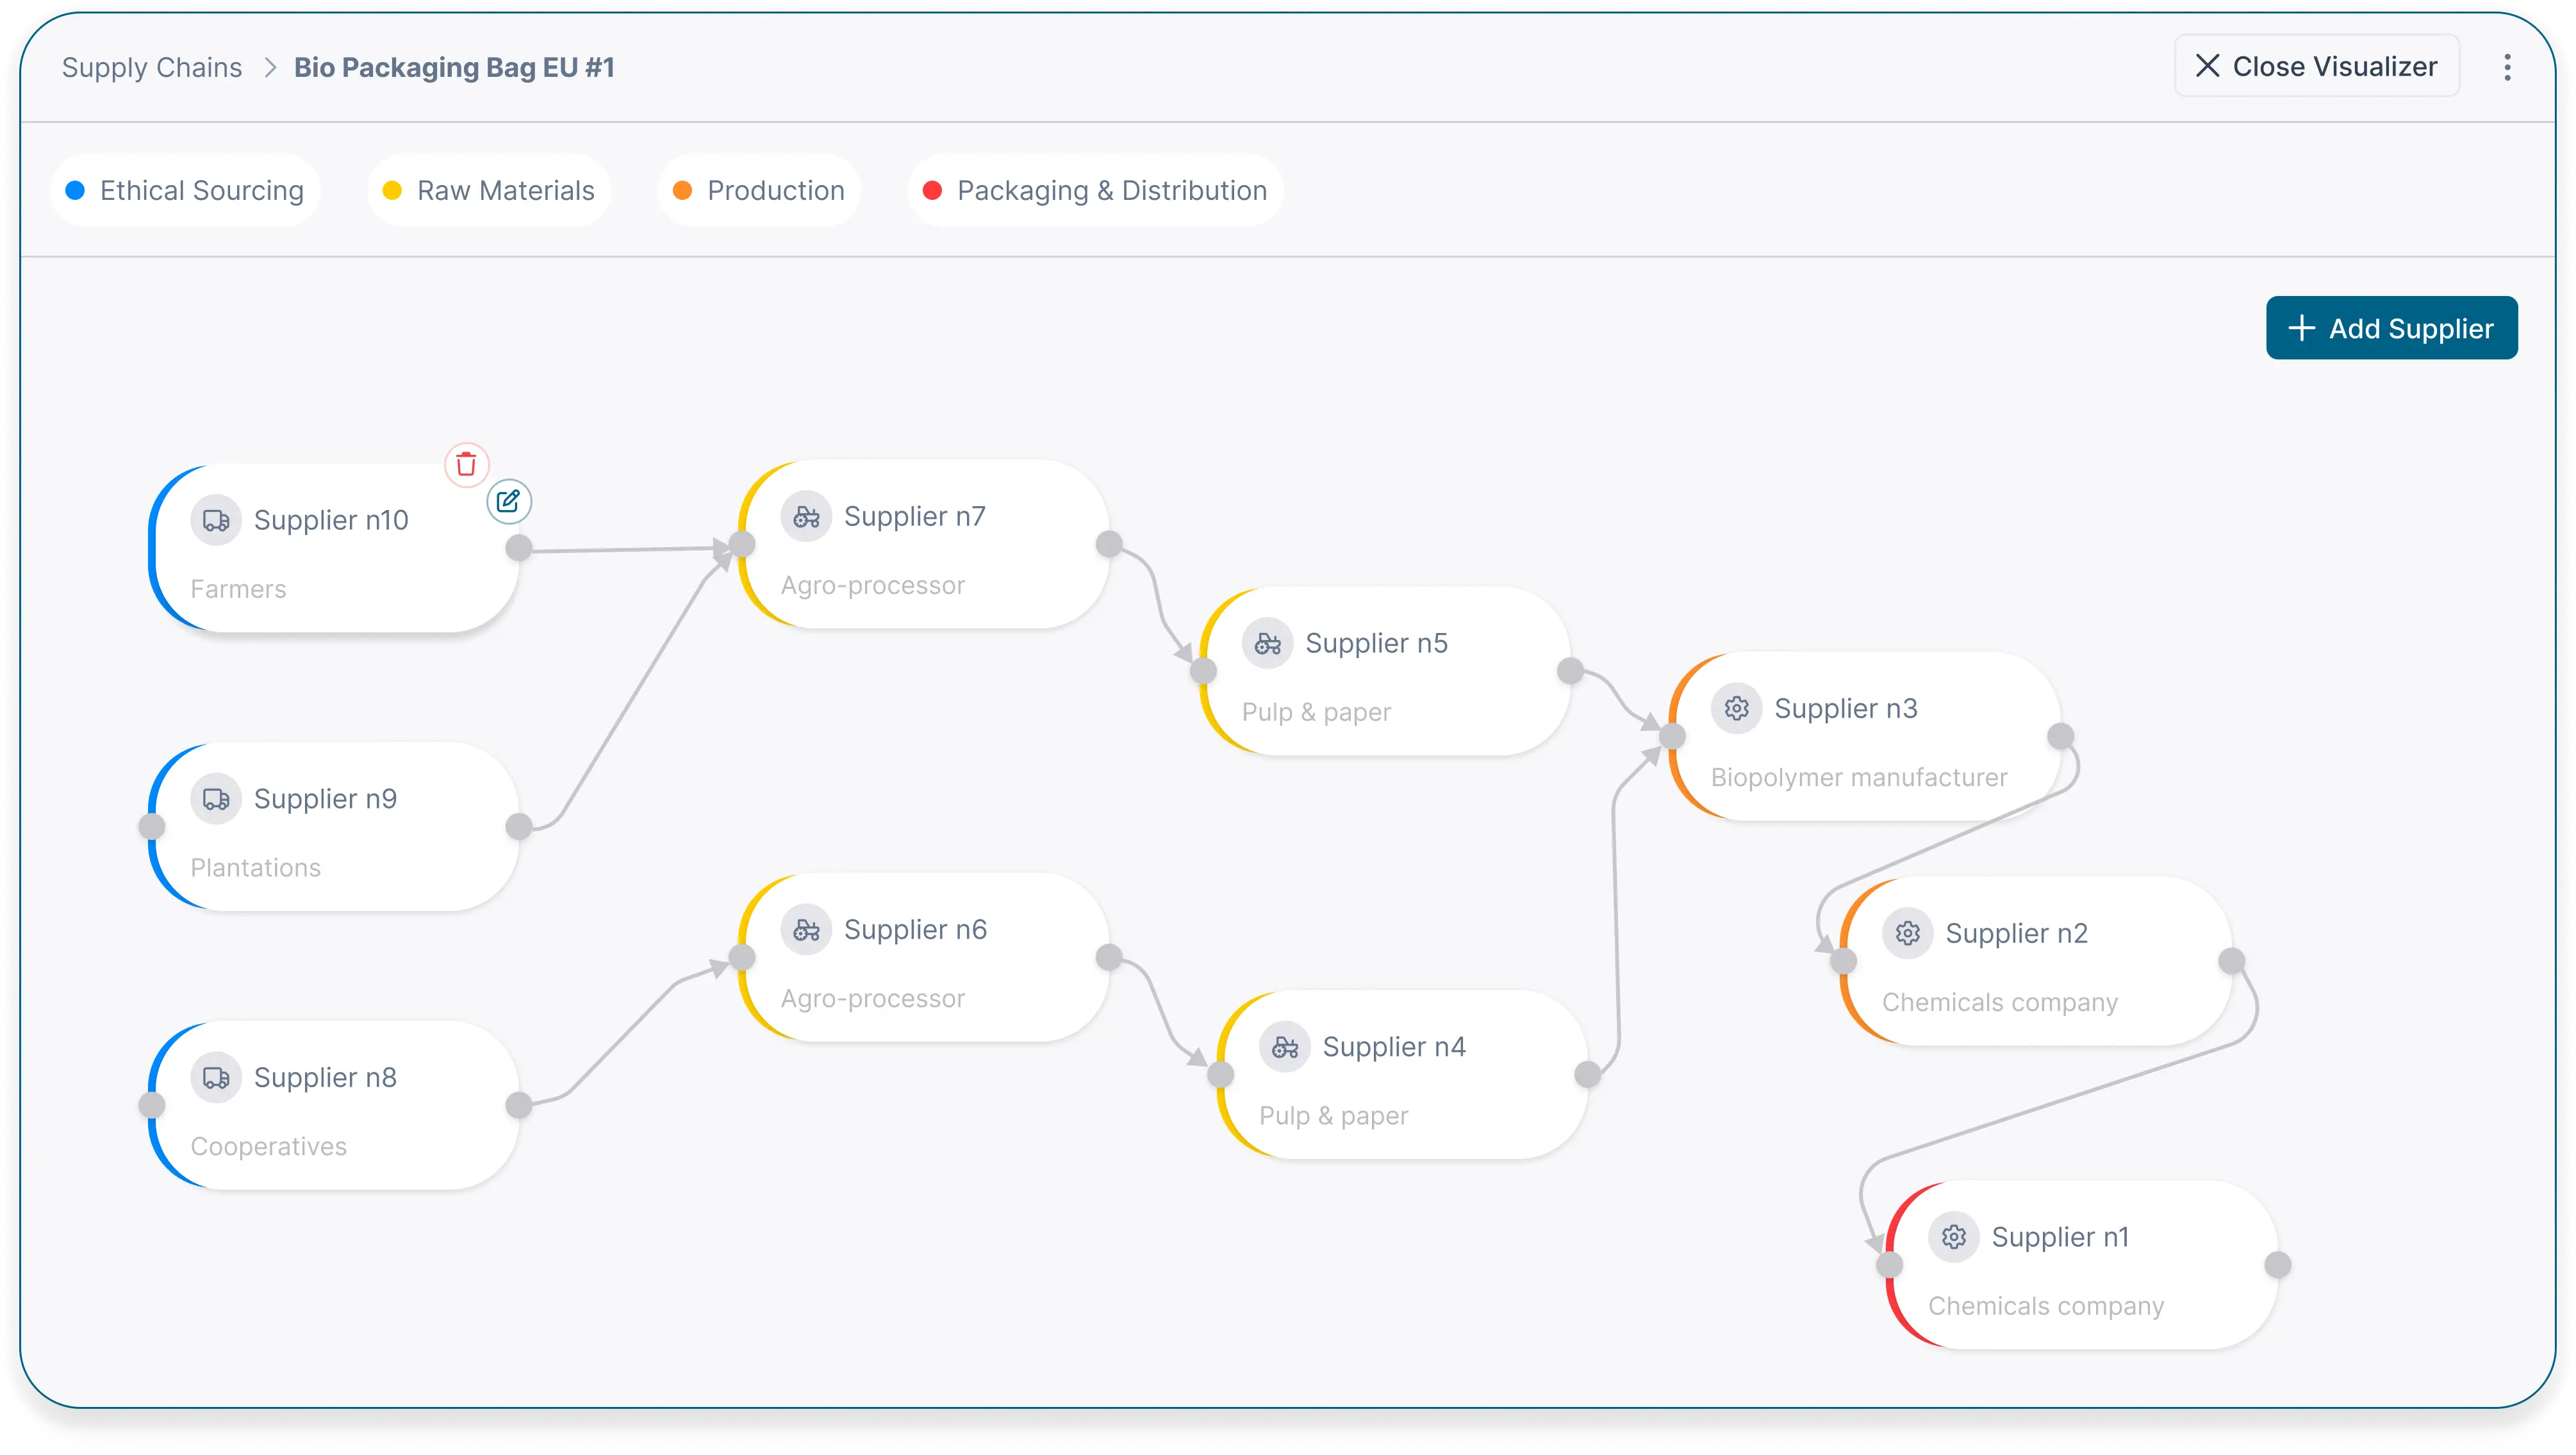
3. Supply Chains
- Build supply chains by connecting products and suppliers
- Visualize multi-tier supply chains
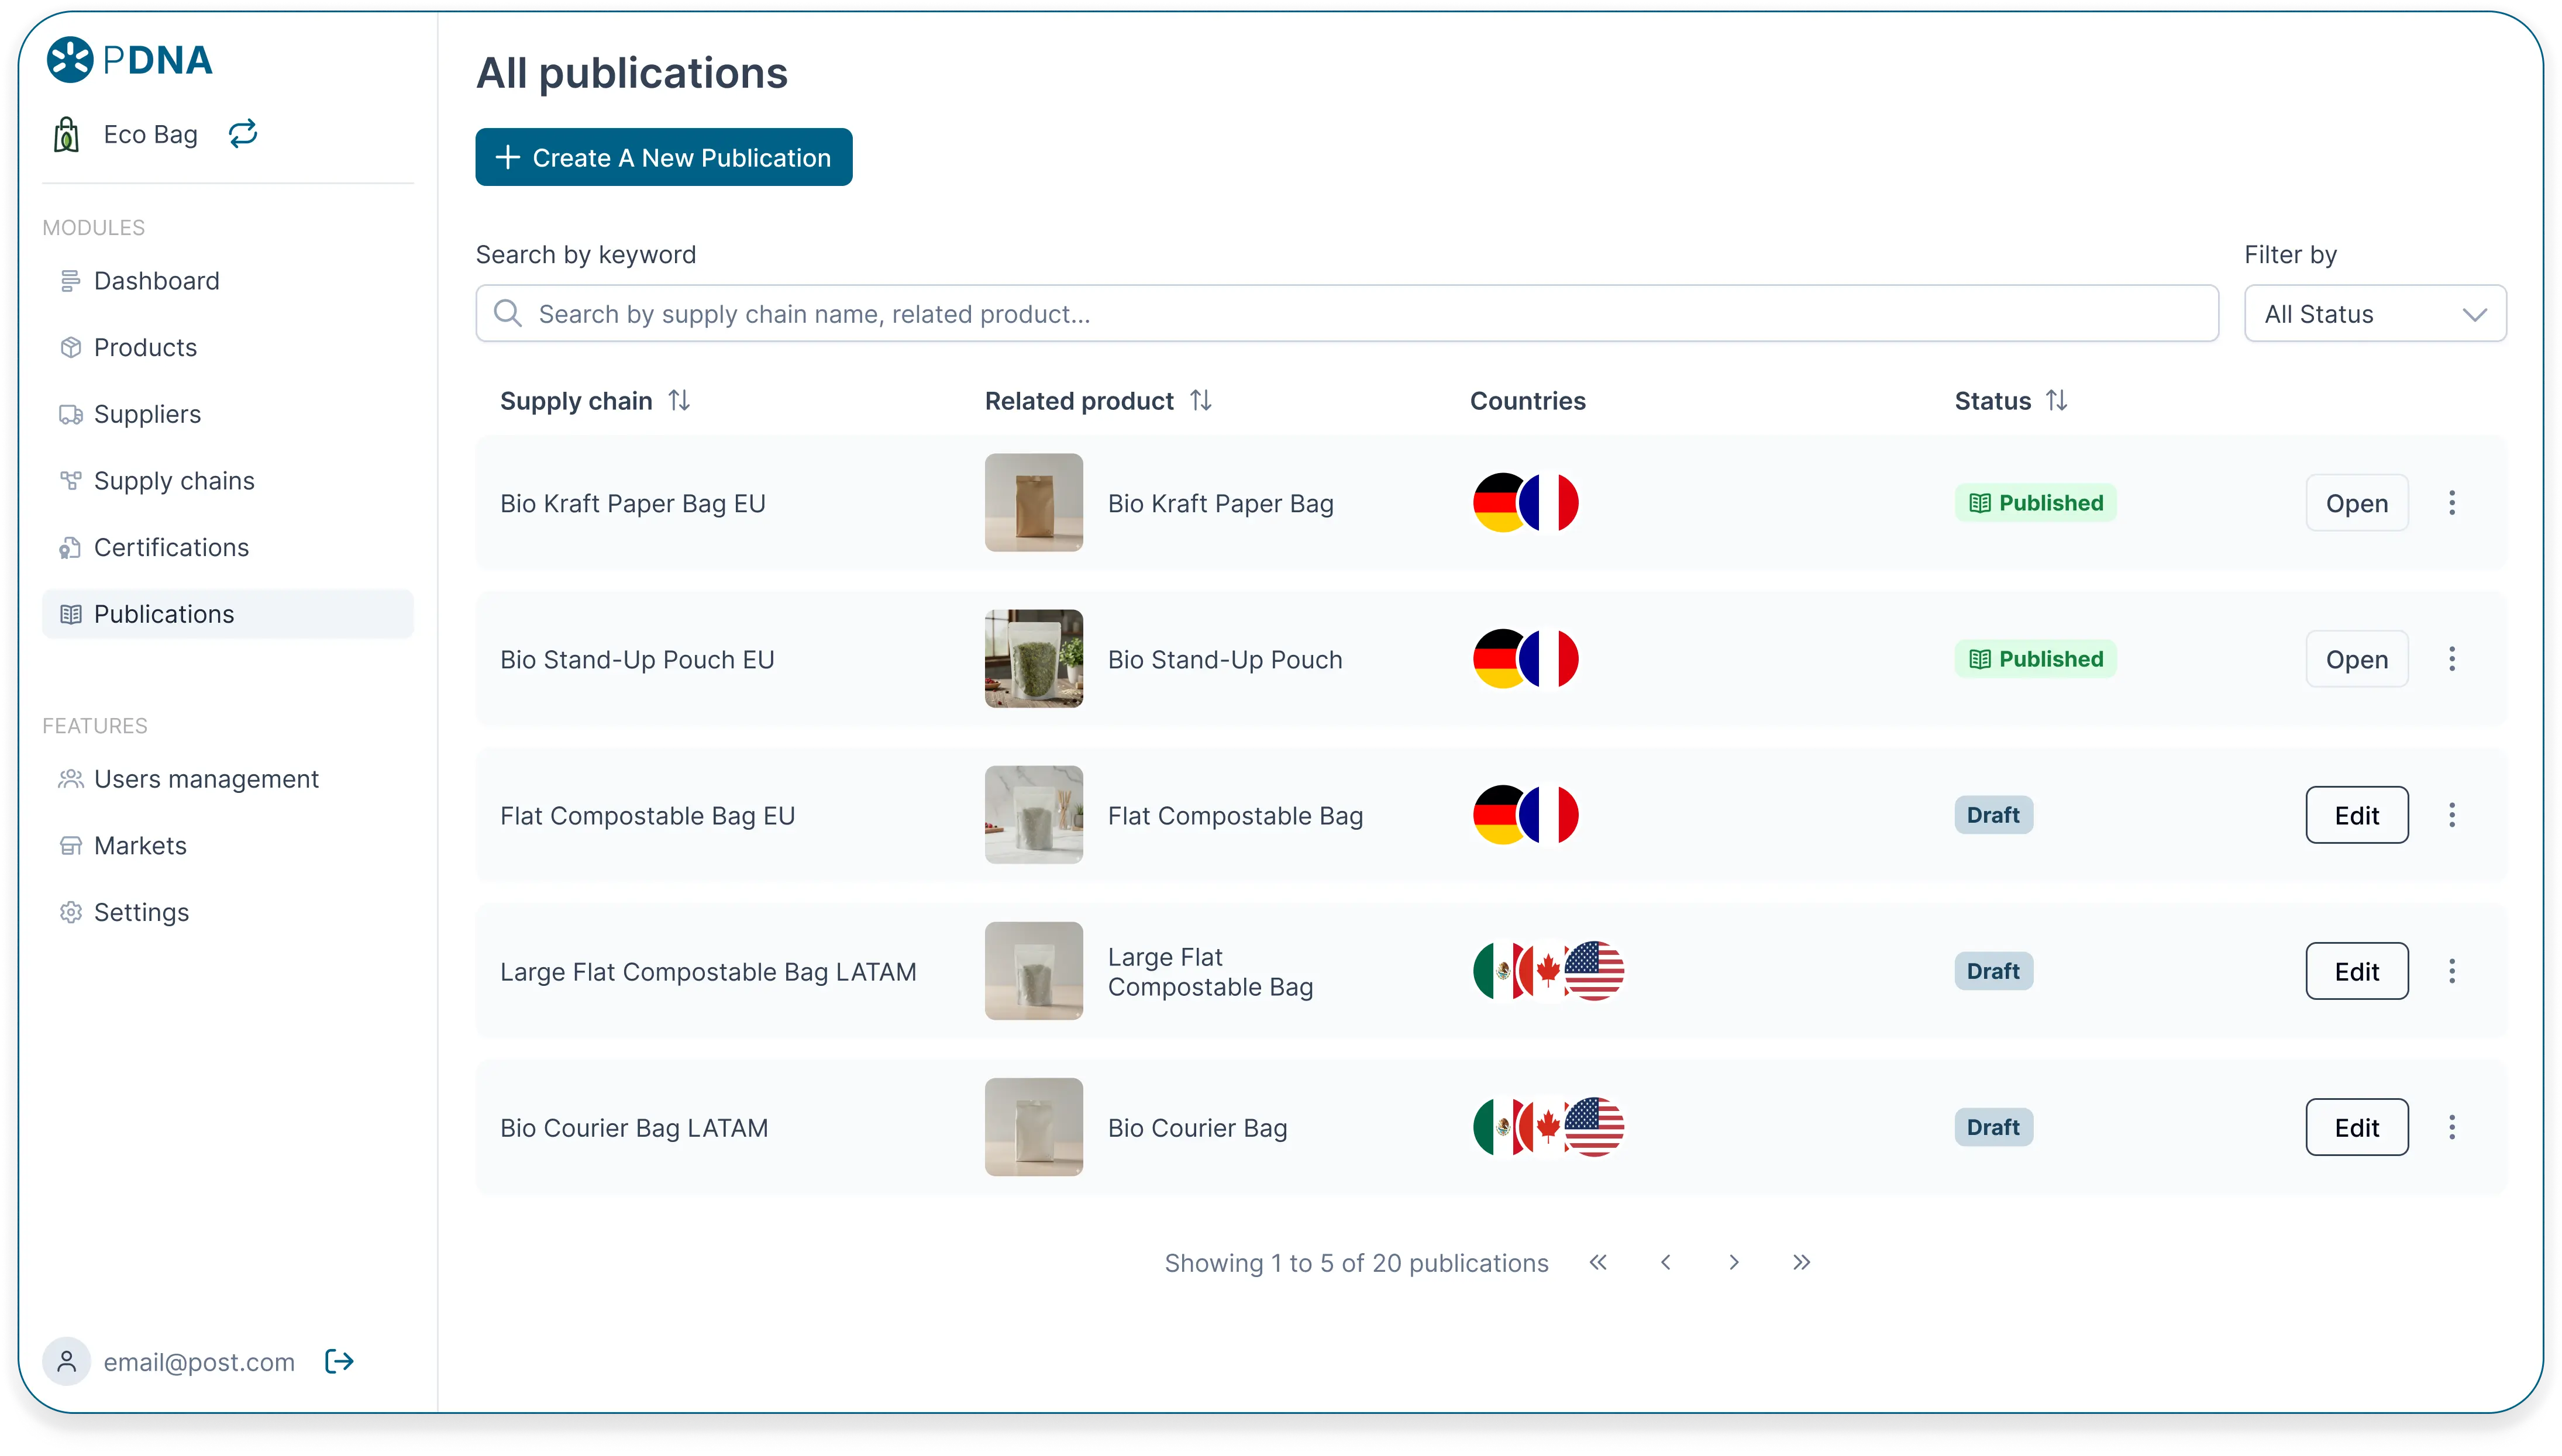
- Control what data is published publicly
4. Certificates
- Upload and manage certificates (e.g. ISO, Fair Trade)
- Assign certificates to suppliers or products
- Track expiration dates and validity
For consistency every module starts with a list of items (example products list), and going further you can access a product page where the product metadata can be managed.
Research & Discovery
building the sections: from wireframes to polished UI

Stakeholder interviews

6 user interviews with sustainability and operations managers

Competitive analysis of existing traceability tools

Review of regulatory documentation and reporting standards

Users think in products first, not supply chains

Visualizing supplier relationships reduces errors dramatically

Importing data is essential, but must be forgiving

Certificates act as trust anchors — users want them visible and contextual

Users fear publishing incorrect data publicly
These insights heavily influenced the information architecture and flow design.
Information Architecture
stage 2
To reduce cognitive load, the system was designed around progressive disclosure:
This mirrors how users already think about their work and avoids forcing them to understand the entire system upfront.
building the sections: from wireframes to polished UI
Key User Flows
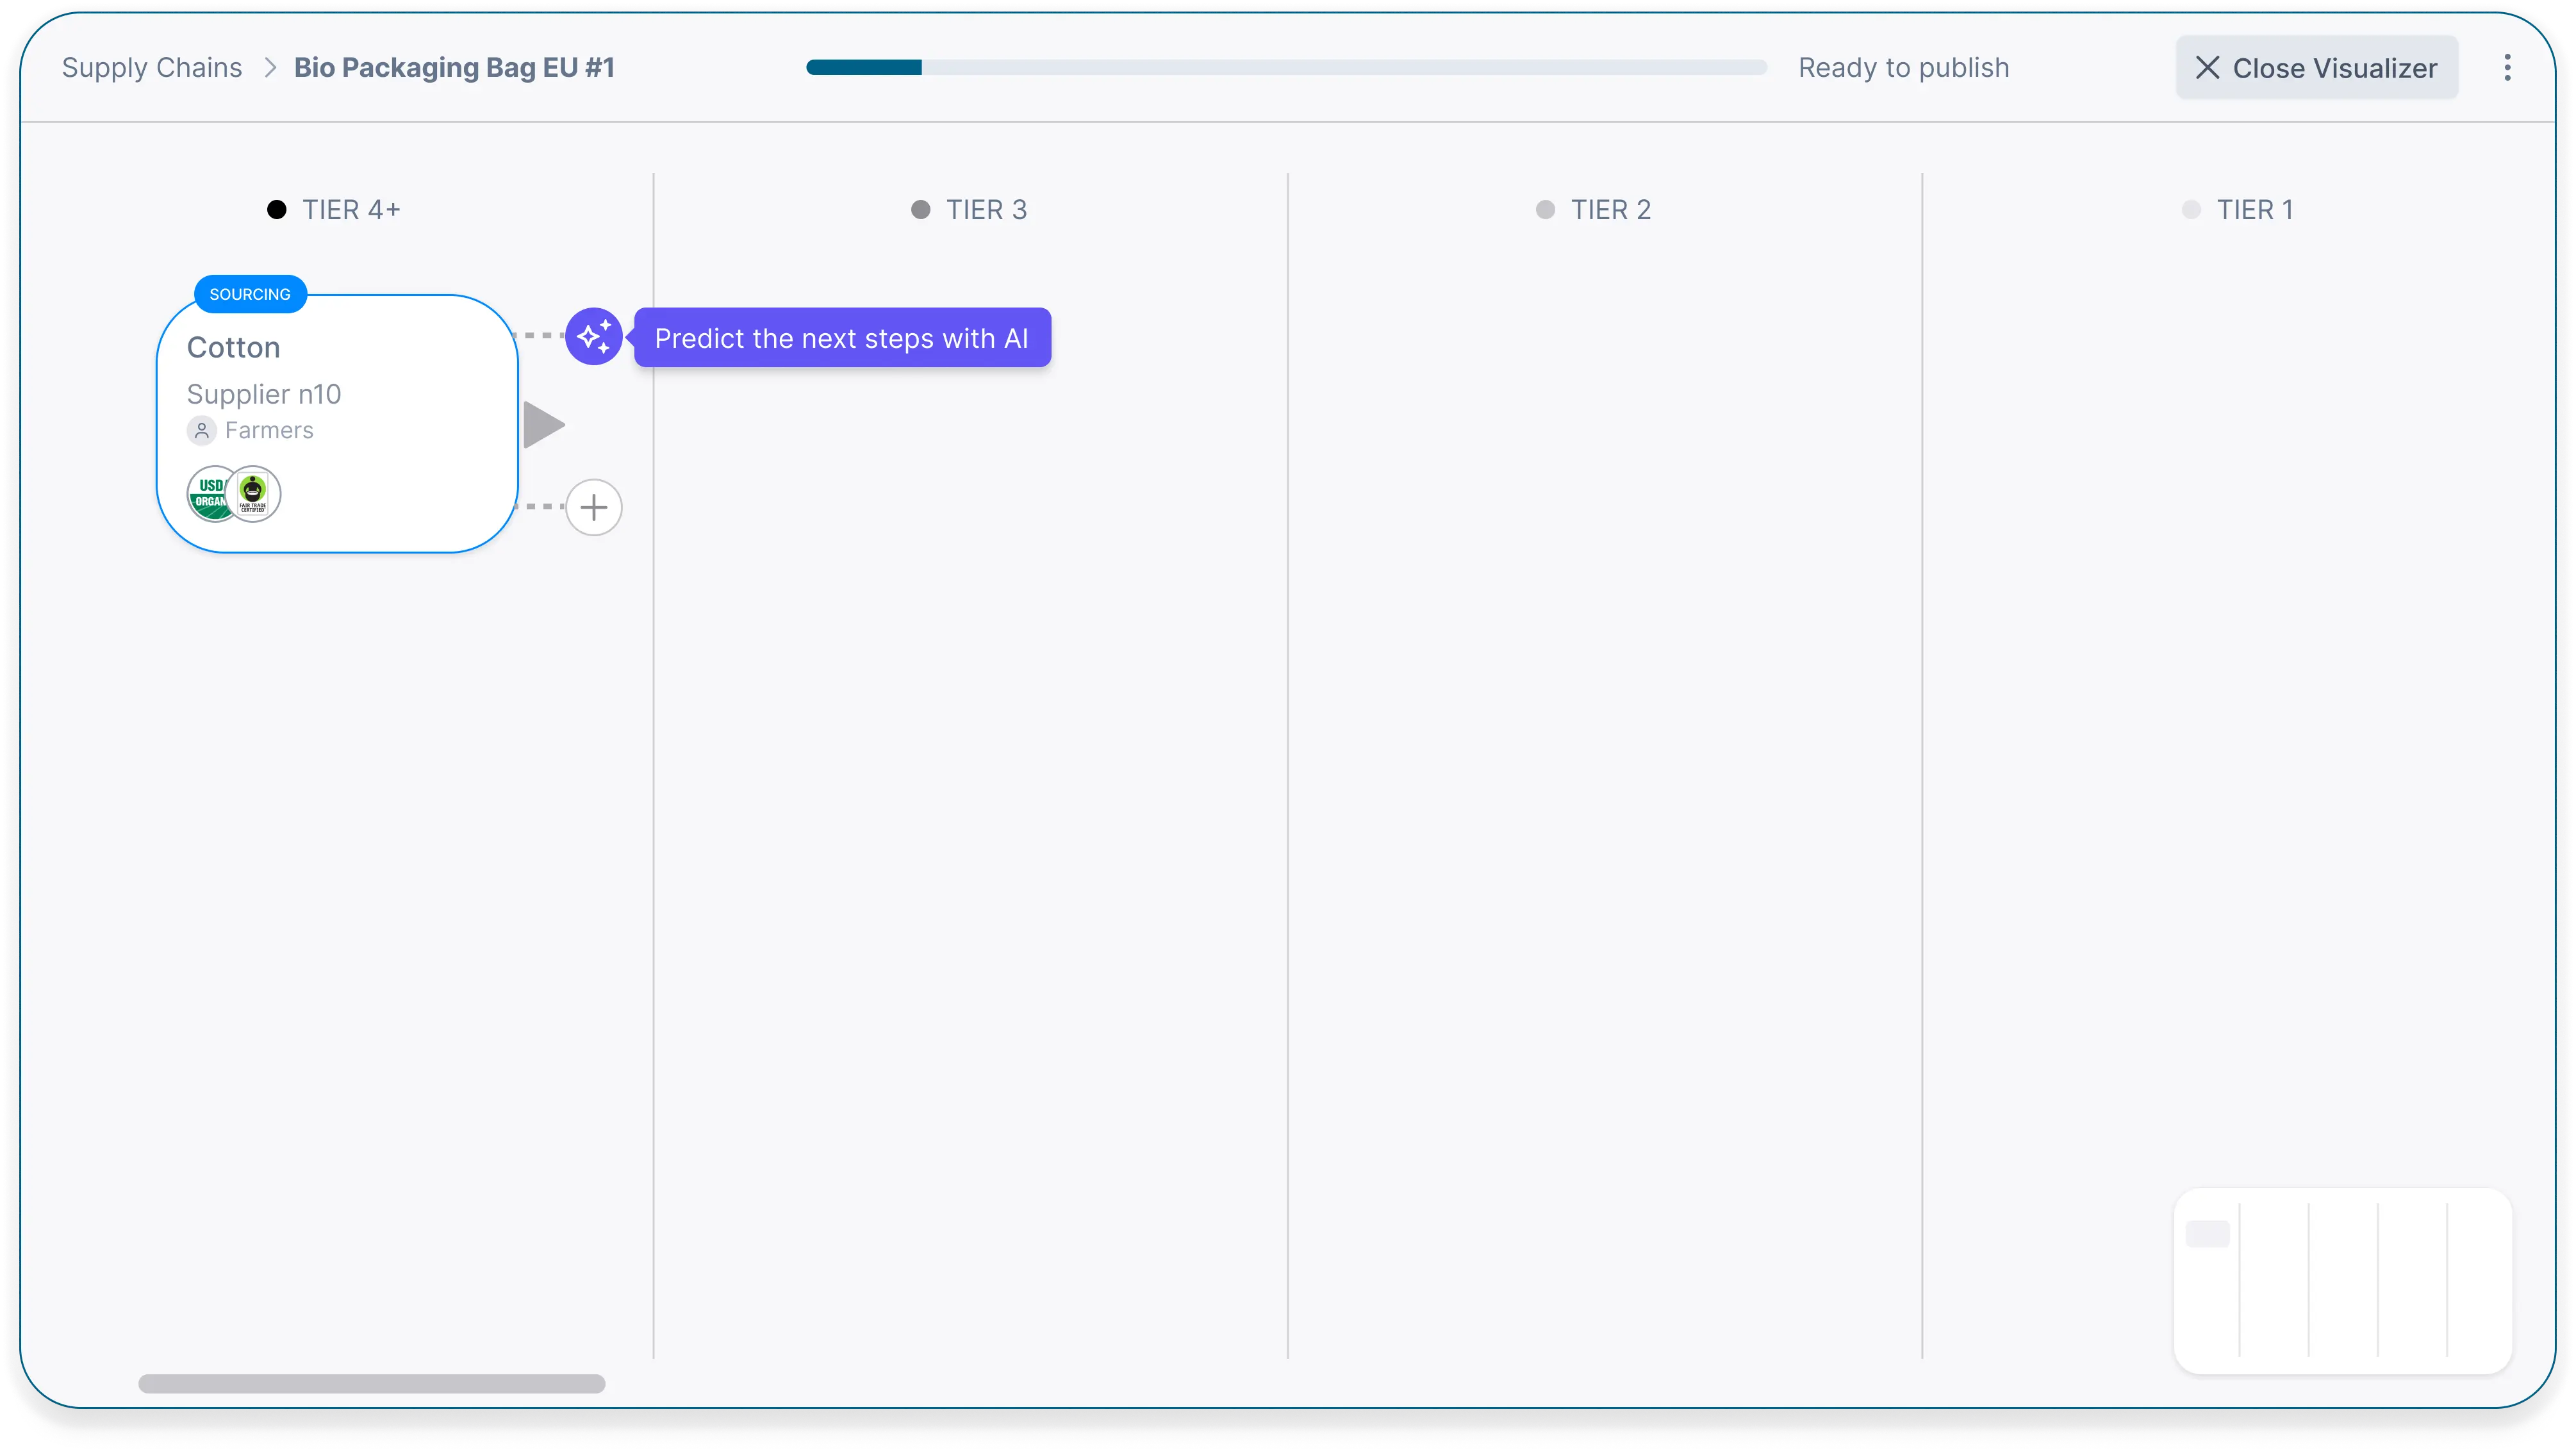
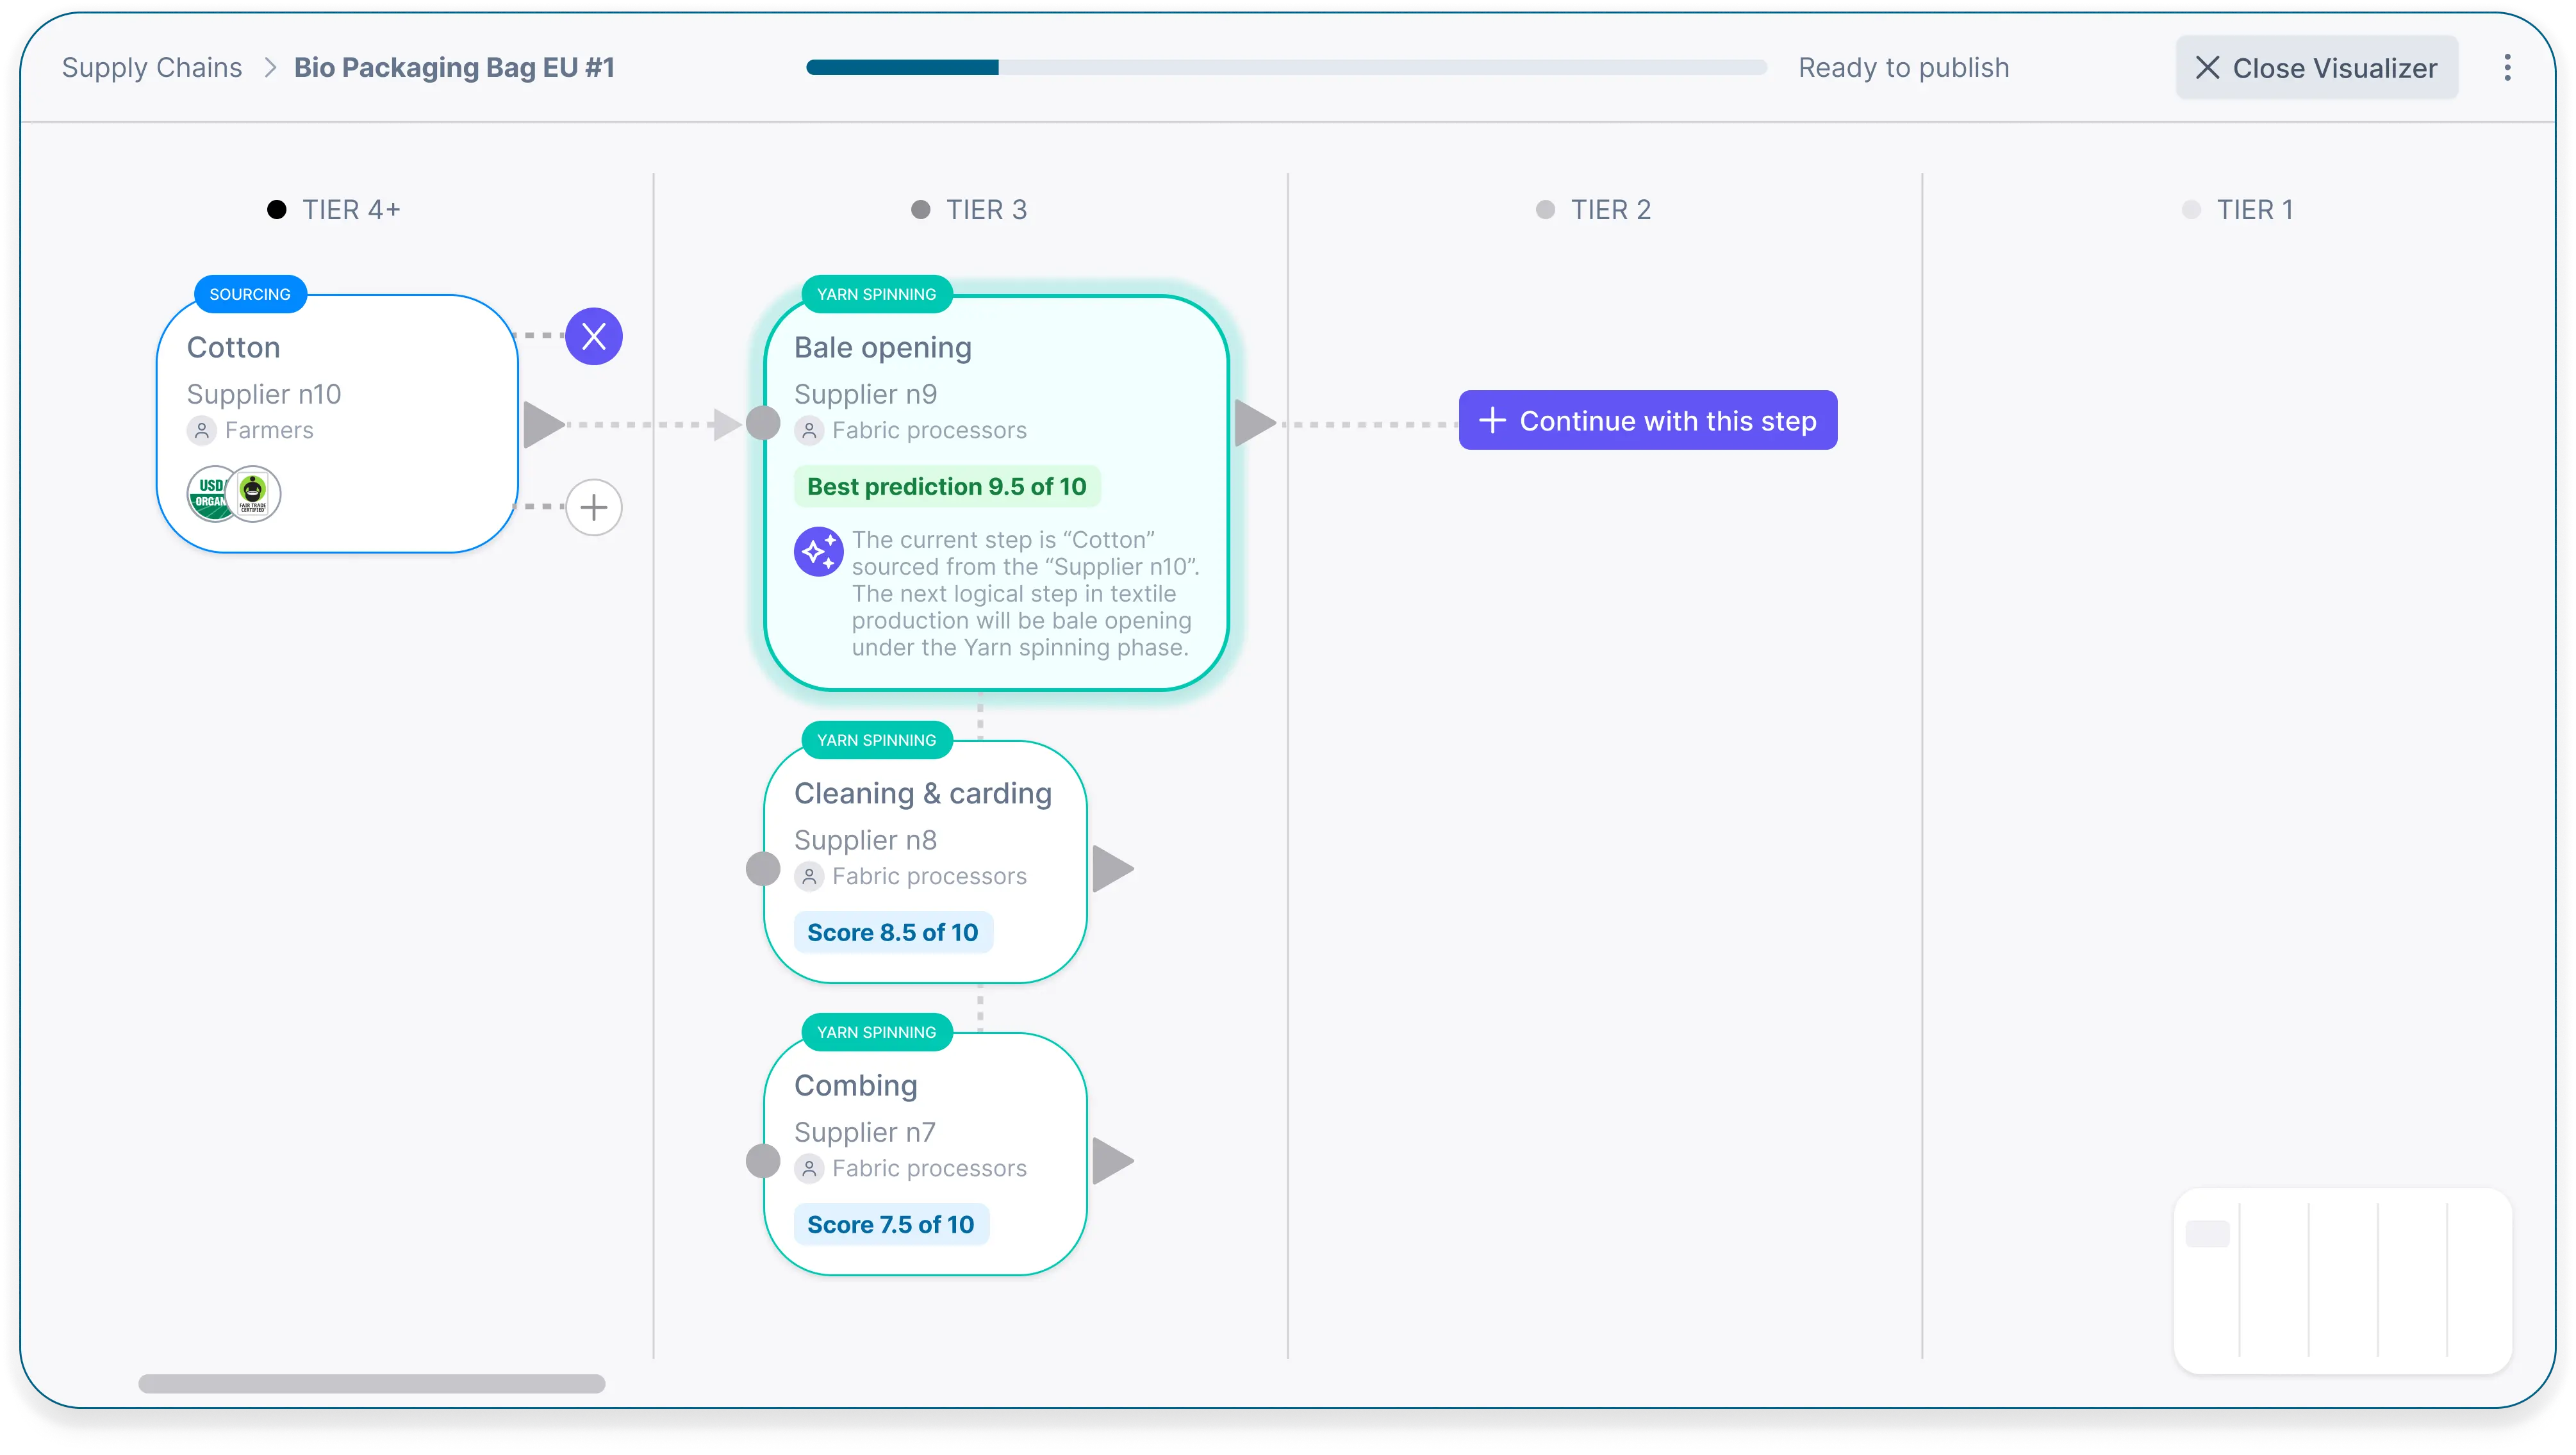
Visual Supply Chain Builder
Instead of forms alone, I introduced a node-based visualization:
- Each supplier appears as a node
- Users can add, remove, or reorder suppliers visually.
- Reduced user errors and increased confidence before publishing.
Import without fear
- CSV import includes mapping previews
- Errors shown before submission
- Partial imports allowed to avoid blocking progress
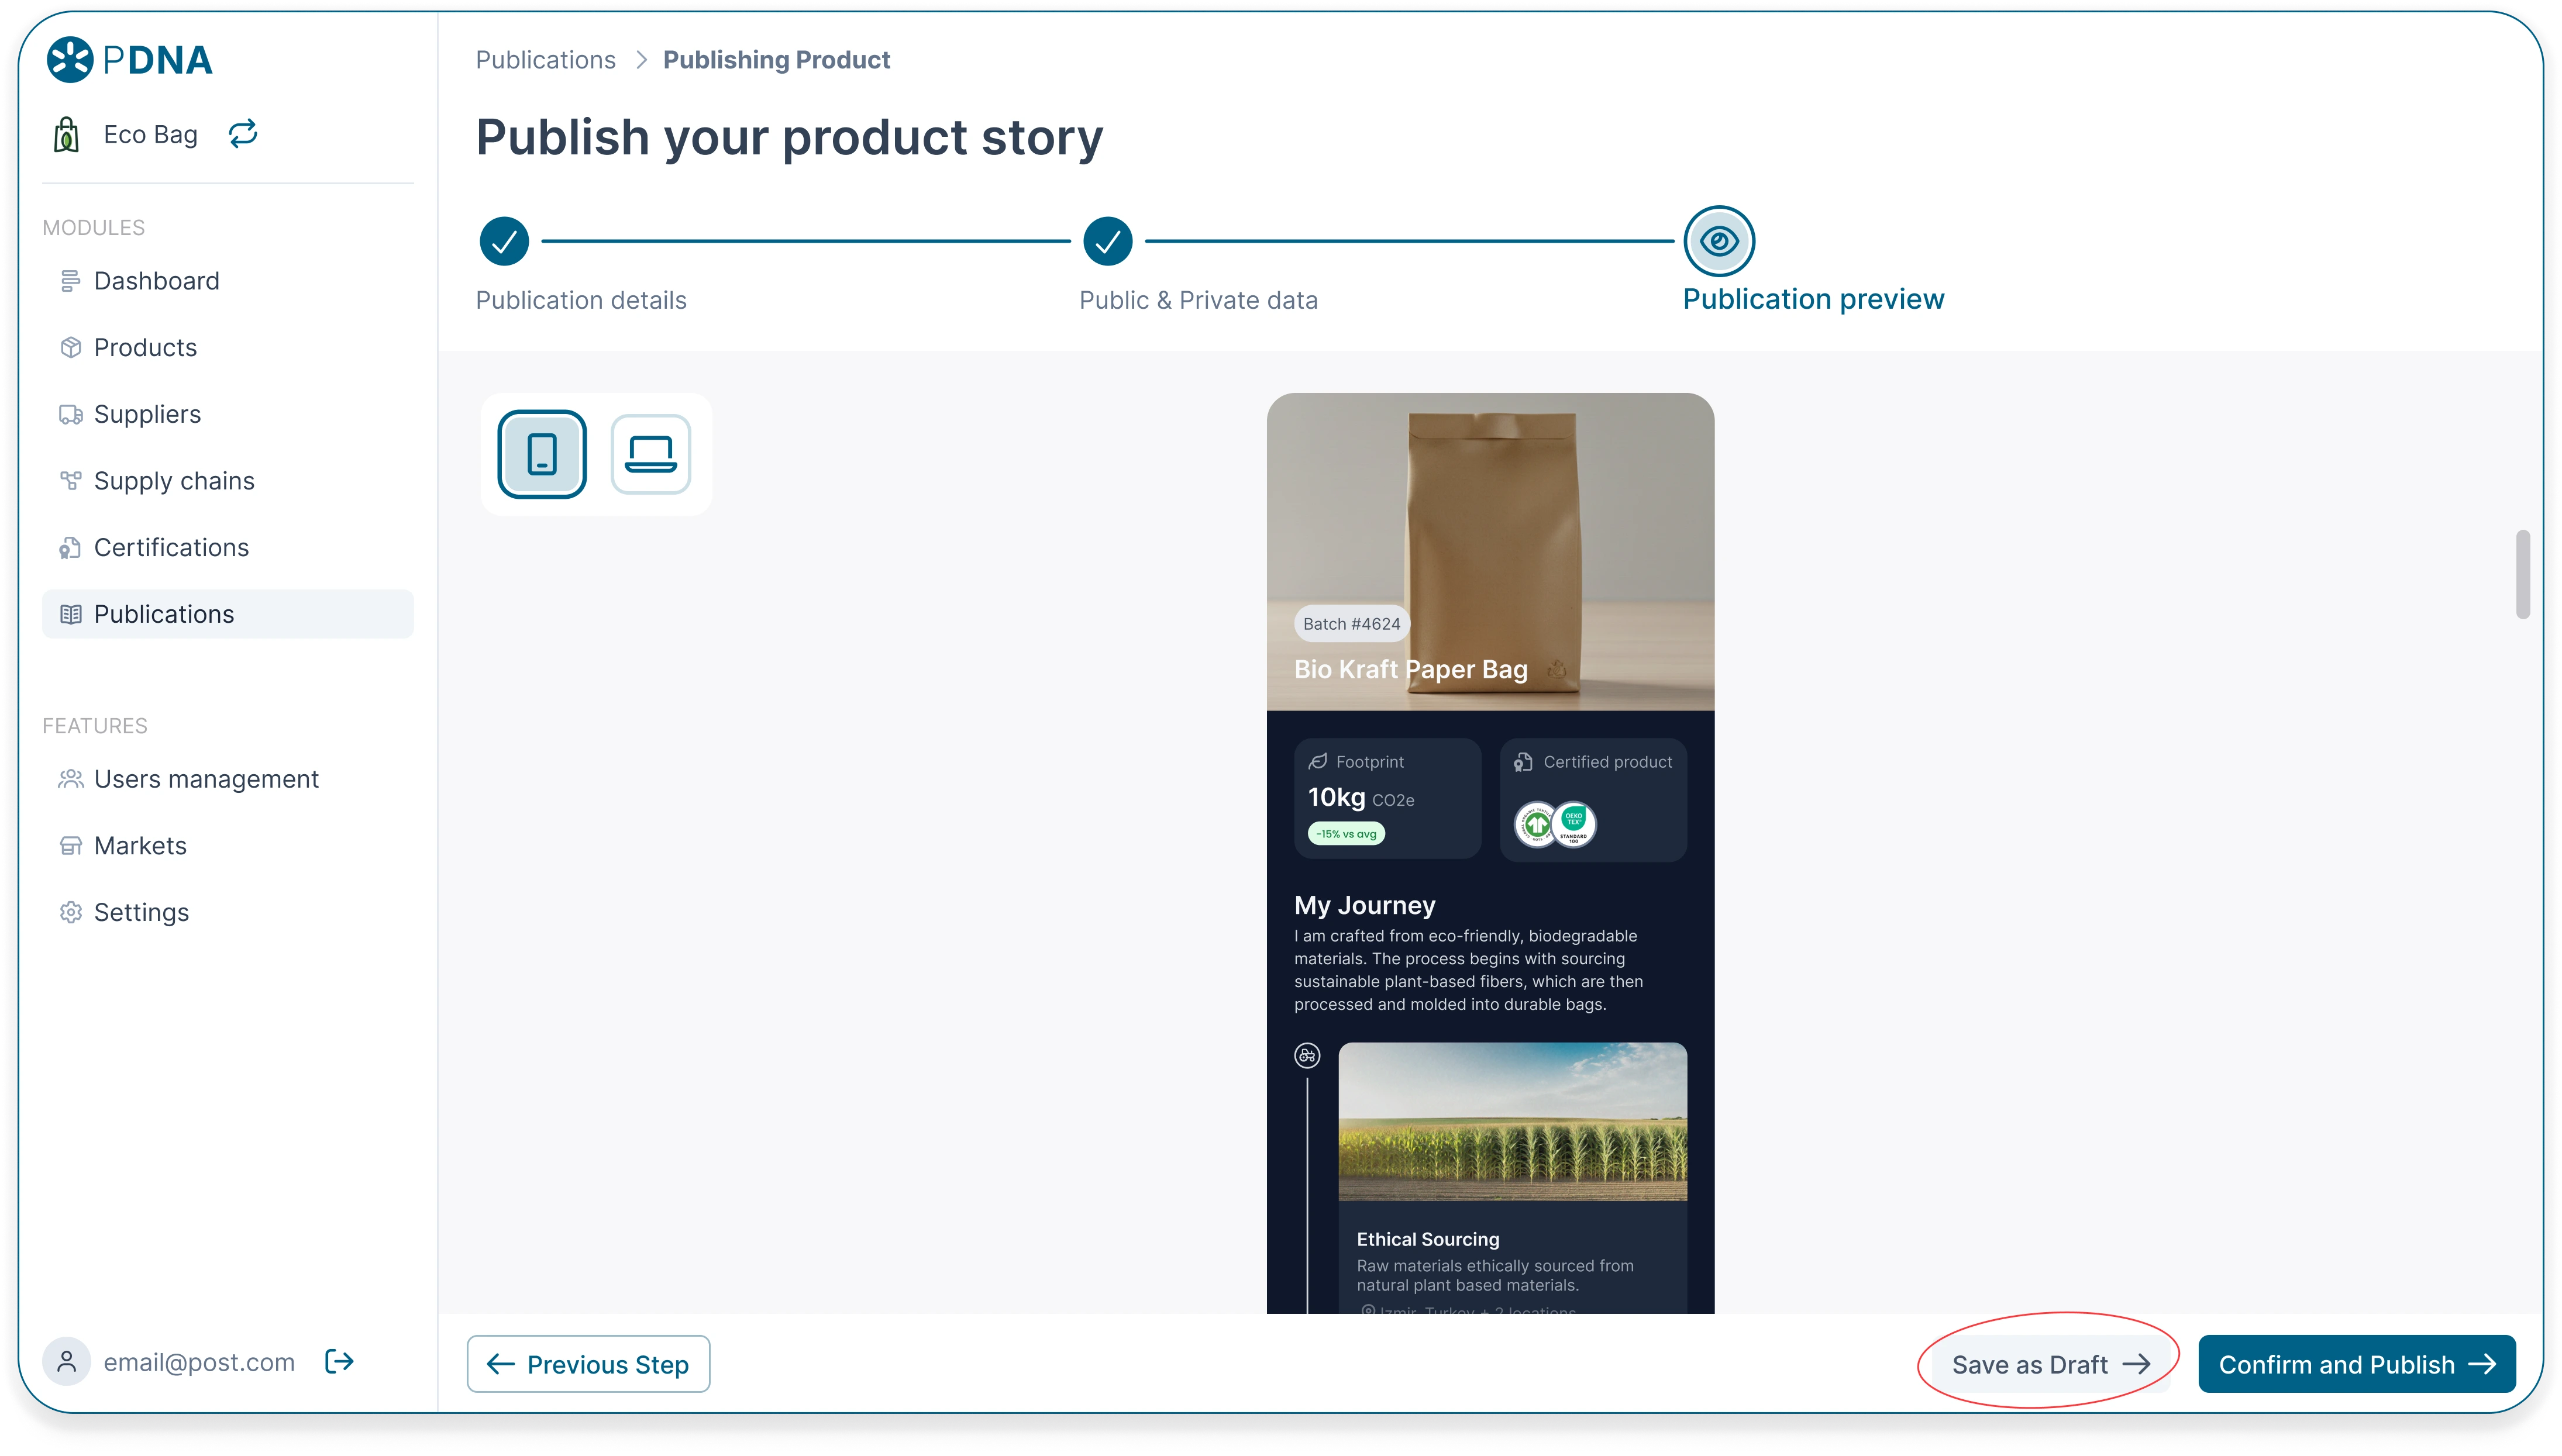
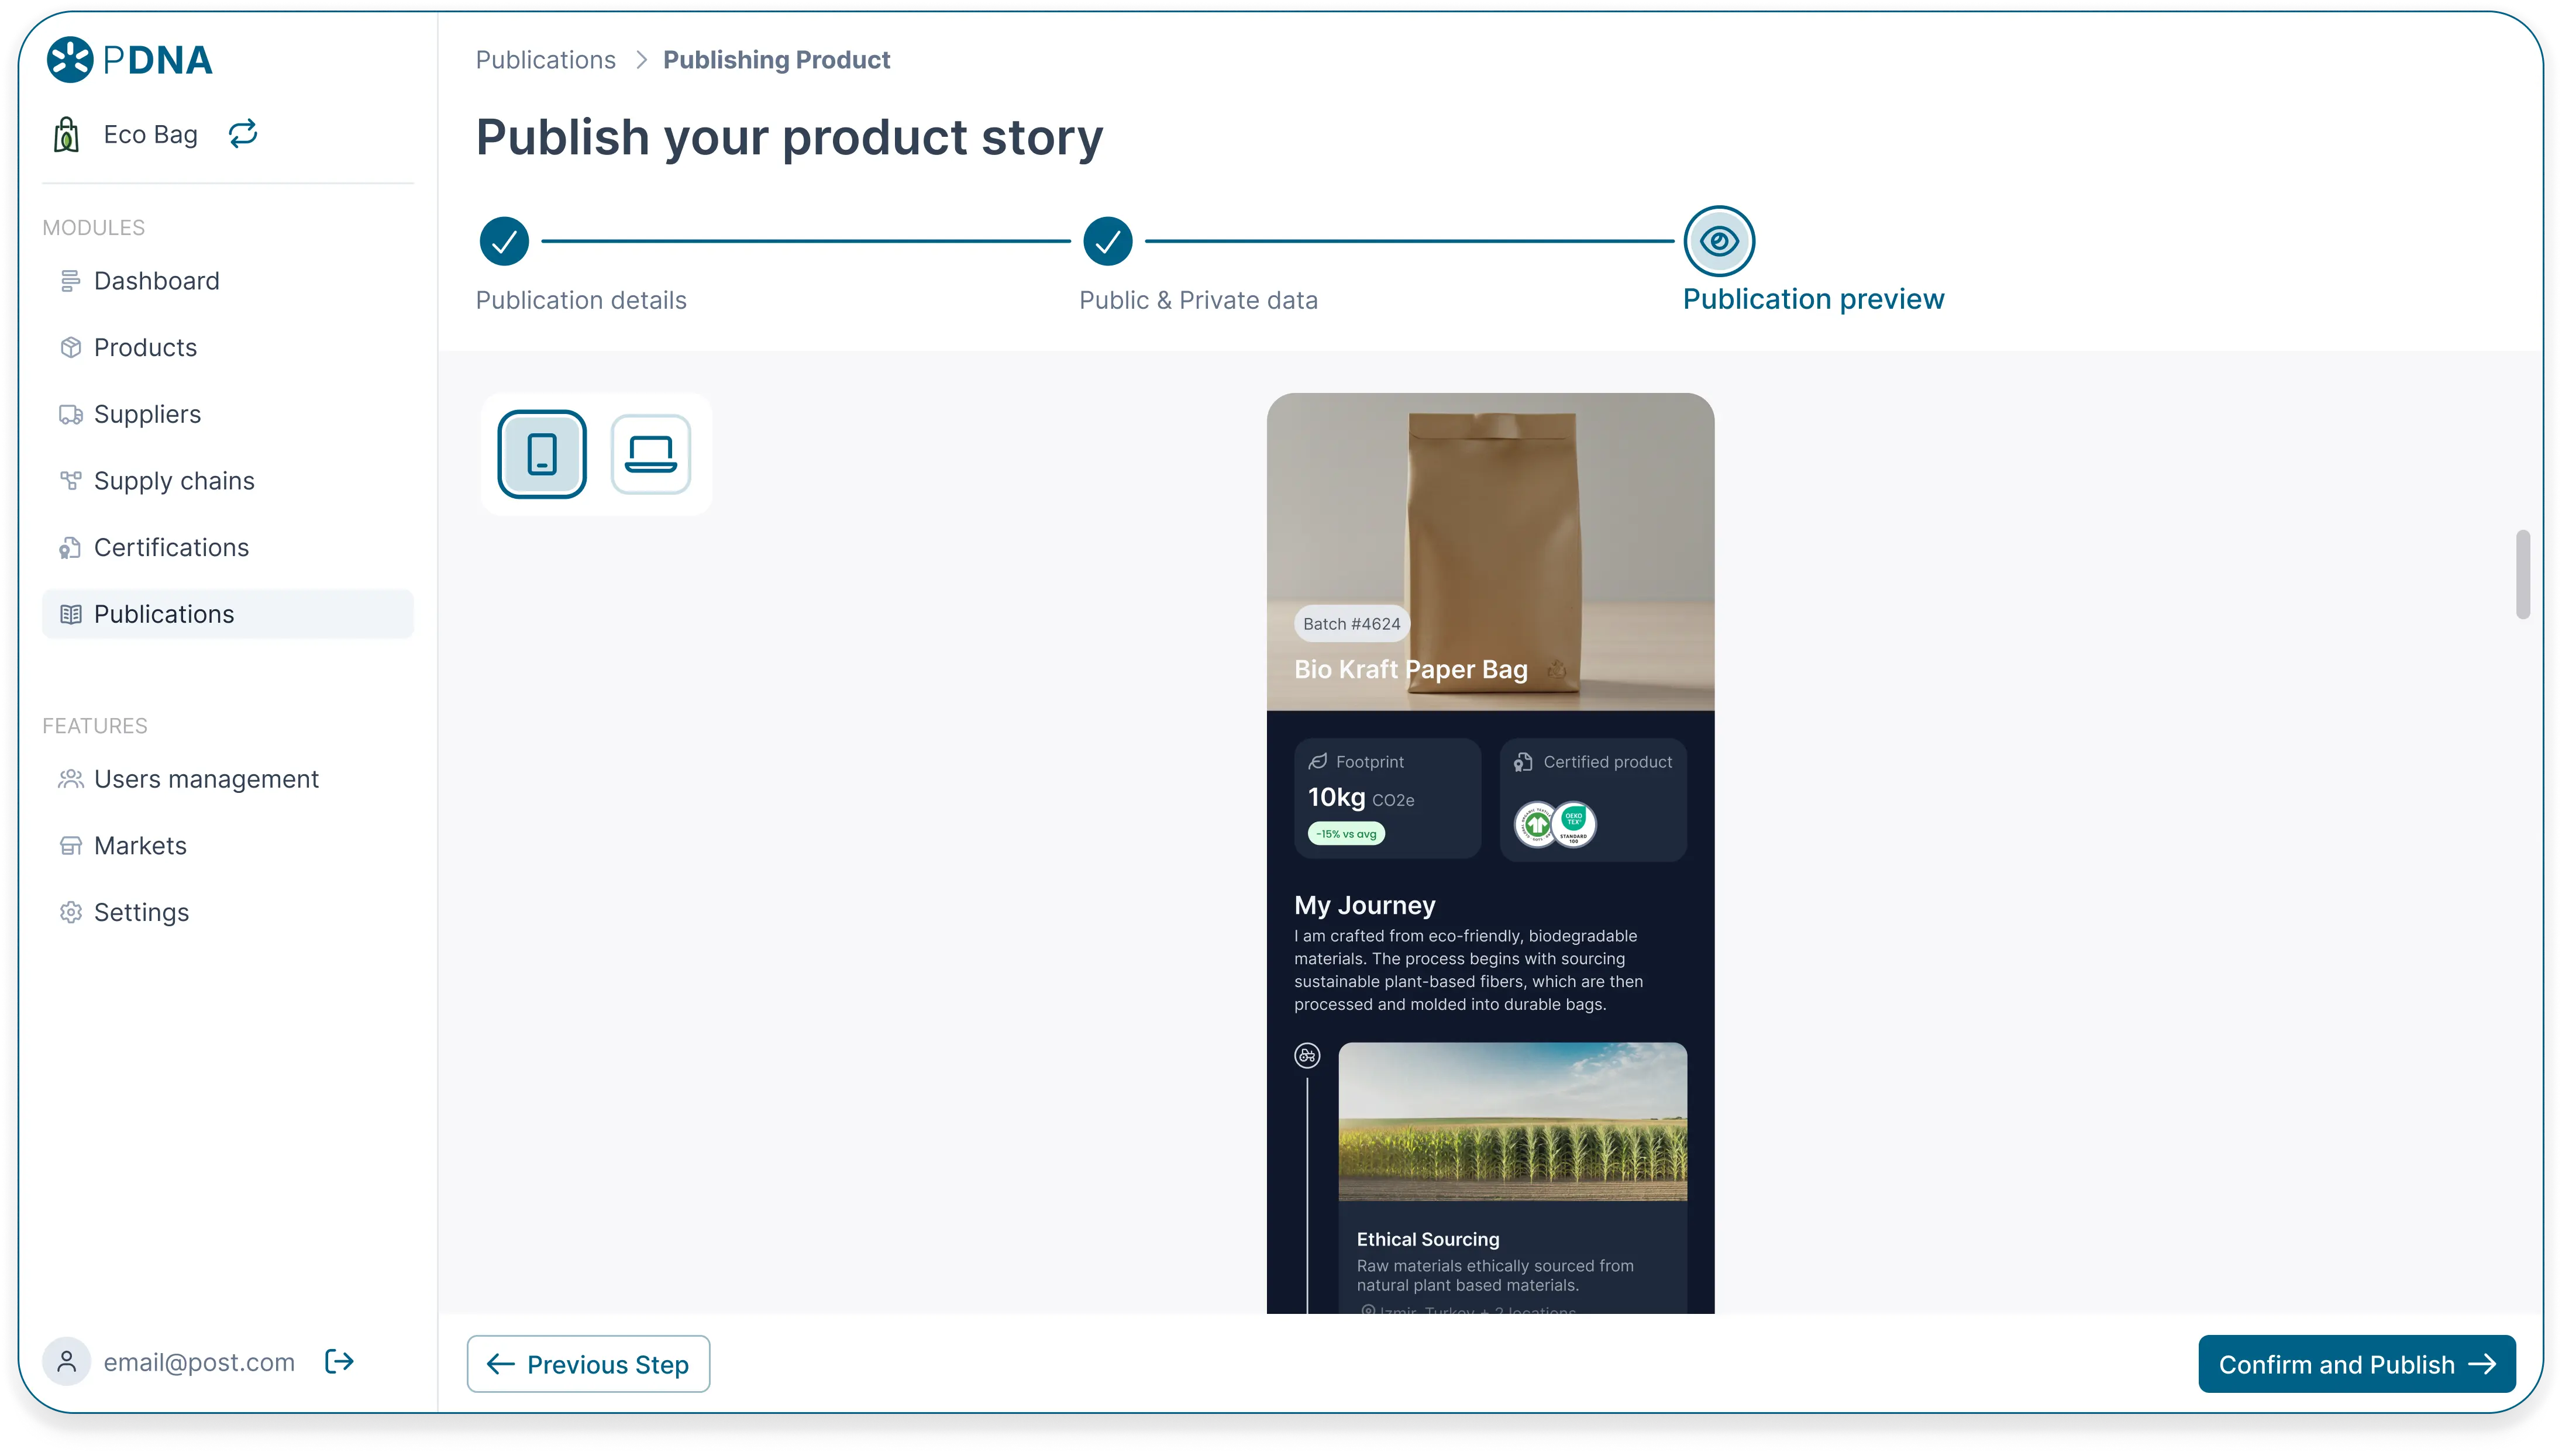
Publish with confidence
- Clear distinction between internal data and public data
- Preview mode shows exactly what consumers will see
- Publishing requires confirmation, not technical steps
Measured Results
- 40% reduction in time to publish supply chains
- 30% fewer data errors after visualization launch
- High confidence scores (4) reported by users: from self reported scores 1 to 5
Qualitative Feedback
“This is the first time I feel comfortable sharing our supply chain publicly.”
“The visual supply chain finally matches how we think about our suppliers.”
Next Steps
adding story mode summary with AI
Ideation and alignment
What worked well
- Product-first mental model
- Visual supply chain editing
- Reusable suppliers and certificates.
What I’d improve
- More automation for certificate validation
- Deeper API integrations with ERP systems
- Consumer analytics on published supply chains and supplier risk analysis
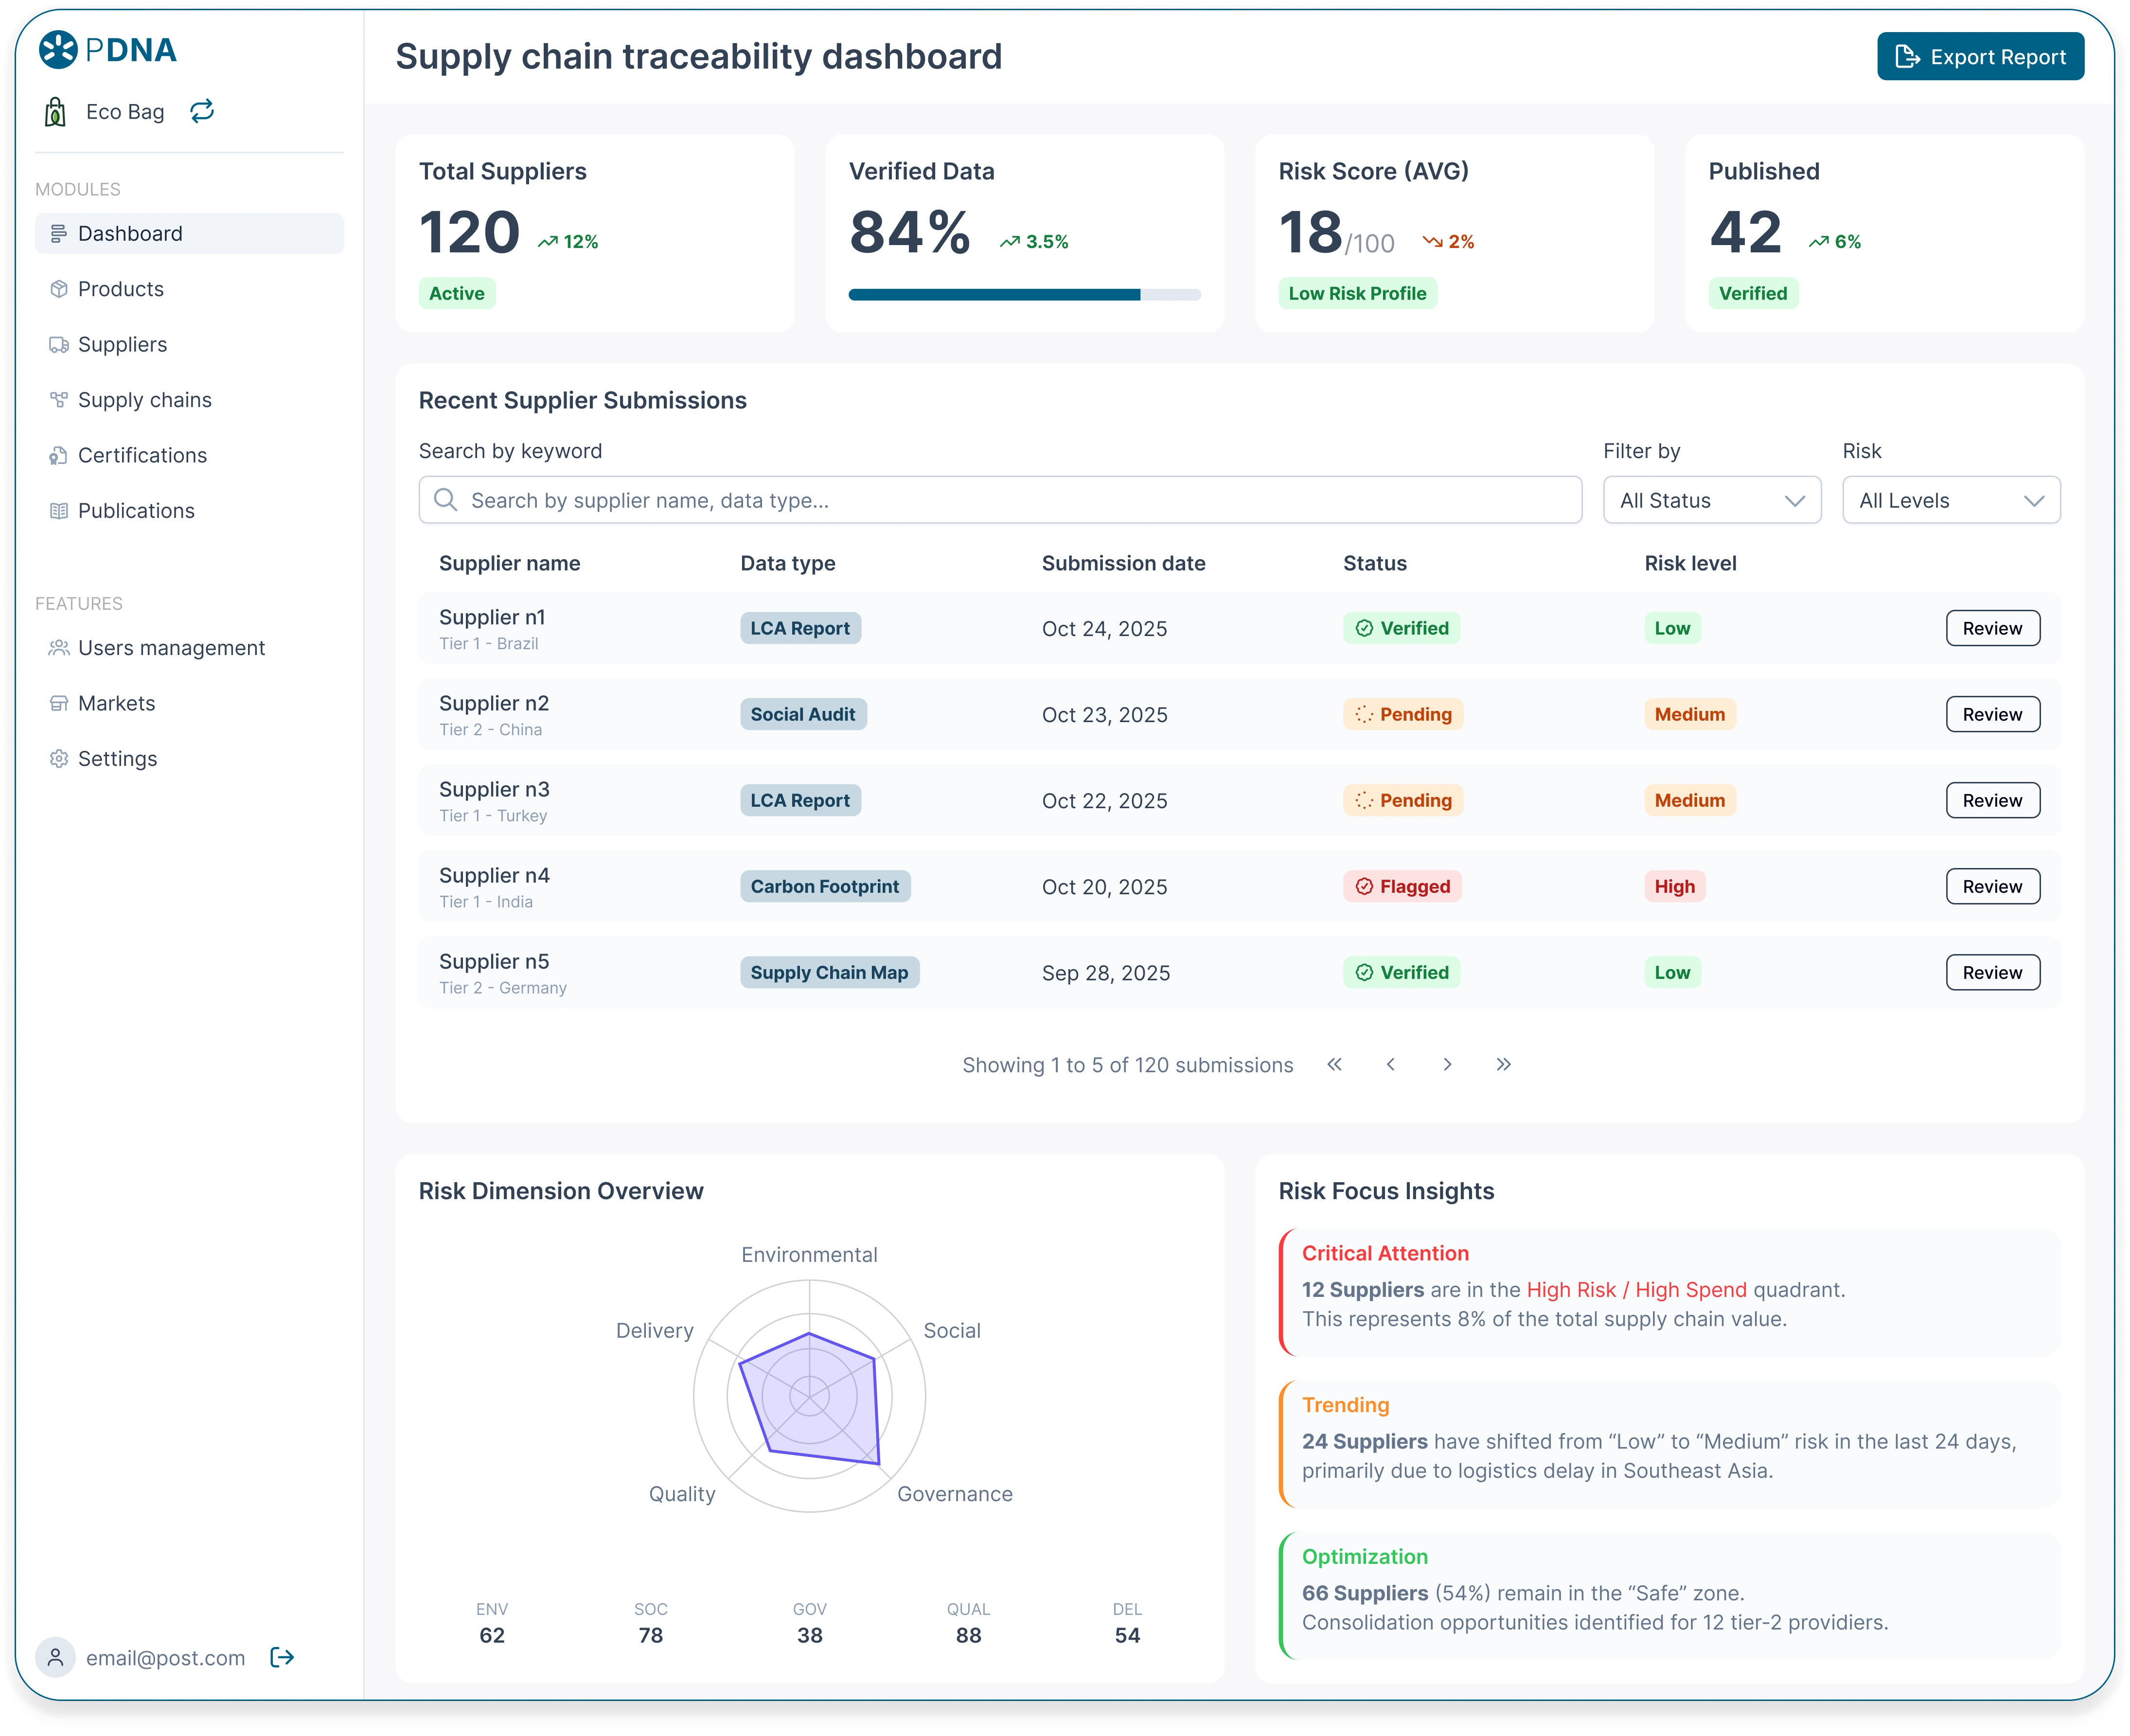
Consumer analytics dashboard - design solution
Designed as a central hub for monitoring supplier data submissions. It includes high-level KPIs for verification progress and a detailed tracking table for recent submissions and their status. Also adding a supplier risk analysis before publishing verified data is essential for credibility, compliance, and long-term sustainability.
Built to facilitate the eventual publishing of verified data to the public transparency platform.